

Computing-Driven Research Insight
Theoretical calculations enable scientific breakthroughs
Computing Services
Catalysis
Oxygen reduction catalysis
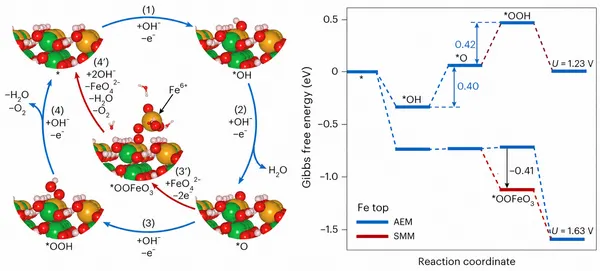
ORR/OER Path
View Details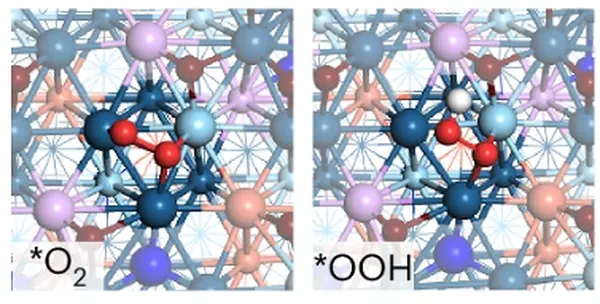
Oxygen Molecule Activation
View Details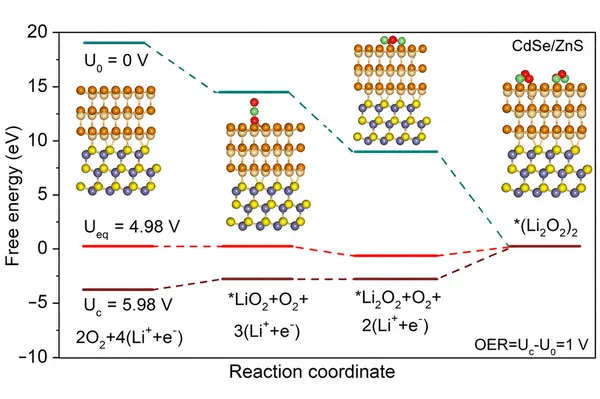
Conversion of Discharge Products
View Details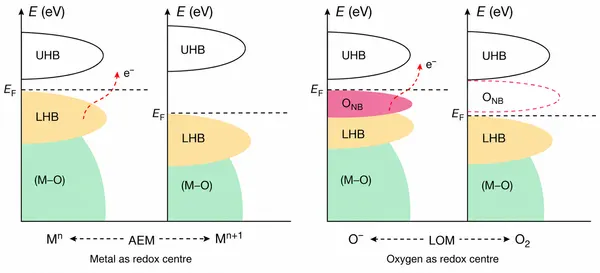
Active Site Analysis
View DetailsSelected Top Journal Cases
Other
Don't let your calculations go wrong because of your graphing! 8 top journal examples to teach you how to create advanced computational graphs
Original Article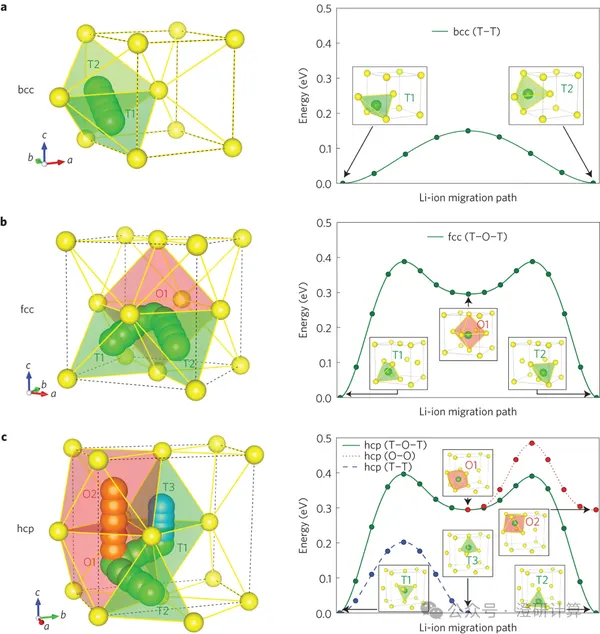
Ion Diffusion
How is ion diffusion calculated? G Ceder interprets classic Nature Materials data
Original Article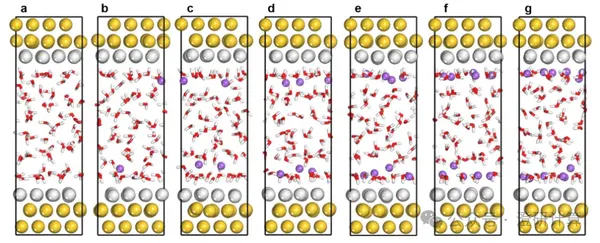
Catalysis
Classic Article on Interfacial Water 1: Li Jianfeng's Computational Interpretation in Nature; In-situ Raman + AIMD Analysis of Pd Interfacial Water Structure and Dissociation Process
Original Article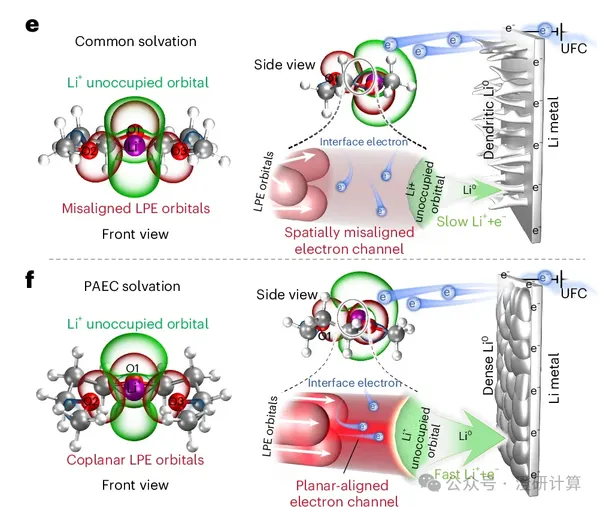
Battery
Nature Energy: How to make changing a solvent molecule sound sophisticated? From DFT, MD to CDFT, see how theoretical calculations can elevate the quality of your papers.
Original ArticleHowever, those that truly get published in high-level journals are rarely as simple as "I changed the molecule, so the performance is better." Rather, they demonstrate whether the authors can elevate this molecular change to a new structural concept, a new interface mechanism, and a complete, verifiable chain of theoretical calculations.
![[Coating MD] From Micropores to Hierarchical Pores: What exactly should battery coating MD simulation be considered?](https://img.chengyankeji.cn/uploads/optimized/1776753751718-20260313-w600.webp)
Porous materials and separation transport / Ion Diffusion
[Coating MD] From Micropores to Hierarchical Pores: What exactly should battery coating MD simulation be considered?
Original ArticleTo thoroughly explain the mechanism of action of coatings in an article, molecular dynamics (MD) simulations are an indispensable tool. It is worth noting that the focus of MD calculations differs depending on the pore size. This article, based on five high-level papers, extracts the MD calculations of coatings into two core physical dimensions according to the material's pore size:
● Microporous systems (pore size < 1 nm): Focusing on desolvation barriers and the "dynamic shuttle" of ions within the coating.
● Mesoporous and hierarchical pore systems (pore size > 2 nm): Focusing on local solvation structures, long-range diffusion behavior, and the synergistic effect of hierarchical channels.
Popular Science
Why is calculating the electrolyte molecular weight (MD) so expensive? What data do I need to prepare before hiring someone to do it? What results can I expect?
Original ArticleMany people think that MD simulation is simply running a testing software program—you input molecules, click "Run," and get the graph. However, in reality, there's a lot of preparatory work required before "Running." How much work is involved, what data needs to be prepared before hiring someone to perform the calculation, and what results can you get afterward? This article will provide a detailed explanation.
Collaboration Workflow
From requirements communication to results delivery, maintain a clear, traceable, and confidential process
Requirement Discussion
Clarify research goals, material systems, existing data, timing, and expected outputs.
Technical Assessment
Assess the computational route, model complexity, feasibility, timeline, and main risks.
Plan Confirmation
Confirm methods, scope, deliverables, communication checkpoints, quotation, and schedule.
Modeling and Calculation
Prepare structures, set parameters, run calculations, record data, and provide stage updates.
Result Organization
Organize key data, figures, mechanism interpretation, and materials for papers or presentations.
Delivery and Feedback
Deliver result files and notes, then refine explanations or presentation details based on feedback.